TCScan+ allows you to see how well your scan settings have worked in the past through its back-testing functionality. You specify various trading criteria on a back-test options form and the program uses them to enter and exit positions on each of the items that passes the particular scan you are running. When your scan is complete, a summary of the profitability of all positions taken can be displayed. Individual statistics, like %profit or days in trade, will be listed within the results table.
There are two important points to note regarding the back-testing. First, all back-testing statistics are calculated on a daily basis, irrespective of your trading time frame. Second, the only back-test setting that is stored in a settings file is the direction of the trade you want to take, i.e. long or short. All other settings are remembered from your previously-used settings.
To see back-testing results you need to:
Run the scan for a date some time in the past. This is done by changing the Shift value on the main form. TCScan+ will take a position one day after the date of the scan and stay in the position until one of your exit criteria are met or until it reaches the current date. So, for example, if you have a shift of 100 days and very loose exit criteria, it could potentially stay in the trade for the full 99 days from the day after the scan date up to the present.
Have back testing enabled. This is the default behavior whenever you enter a value for Shift greater than 0, but you can disable it on the back-test options form.
Enable
one or more statistics to display. Some are selected by default and
you can modify them as you require. ![]()
Specify
position direction and size and one or more entry and exit methods, so TCScan+ knows how
to enter and exit positions. ![]()
Allow
shift days to be shown on your charts. This is not necessary to have
trading statistics calculated, but if you want to see an arrow on the
chart showing where the position was exited then you need to show the shift
days - see below for an
example. The vertical red dotted line shows the scan date (where the
trade was entered) and the cyan exit arrow shows where the position was
closed. Trade statistics from the results table can also be shown
on the left of the chart. ![]()
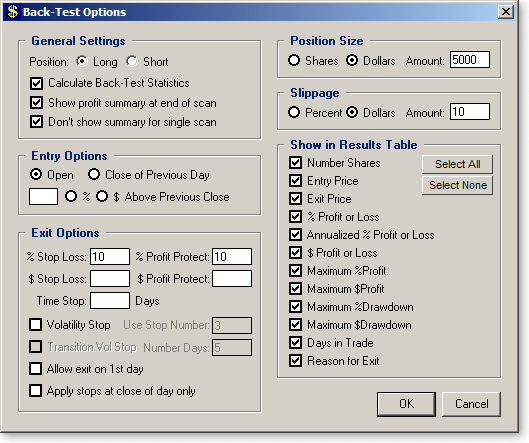
Back-Test Options
The
back-test options page is displayed by selecting Back-Test Options from
the Options menu or by pressing the Shift-F3 key
combination. An example is shown below.
You can click any part of the picture to be directed lower for more information
on a specific item. ![]()

|
|
Position: specifies whether to take a long or short trade position. |
|
|
Calculate Back-Test Statistics: determines whether back-test
statistics will be calculated ad displayed.
|
|
|
Show profit
summary at end of scan: if checked, will cause a
form to be shown at the end of a scan summarizing all the positions taken.
An example is shown below. This form can also be shown from the
view menu
after the scan. |
|
|
Don't show summary for
single scan: if checked, a trade summary form
will not be shown when a single
item scan is run. |
You
can enter one or more of the following criteria for closing the position.
For each day in the trade, TCScan+ will calculate the specified exit point for
each stop type and will close the position when any one is hit. To ignore
a stop type, leave empty the box that holds its value. ![]()
|
|
%
Stop Loss: exit the position if price falls to a point where
percentage losses exceed the specified number. For example, you
enter a position of 100 shares at $5 and have a % Stop Loss of 10.
If the price per share falls below $4.5 the position will be closed.
Since intraday data is not available, TCScan+ has to guess about price
movement within the bar. If a bar gaps open below the stop point, it
will take the exit at the opening price. If the low of the bar is
under the stop point, it will exit at the stop point. |
|
|
%
Profit
Protect: similar in nature to the stop loss, the profit protection
calculation keeps track of the most profitable point in your trade to date
and exits if the price falls below the specified percentage off the most
profitable point. For example, you purchase 100 shares at $5 and
have a 5% profit protection stop in place. After a few days price reaches
a high of $7 and then starts falling. The position will be closed if
price falls below $6.65 (5% off $7.) As for the stop loss, if a bar
gaps open below your profit protection point, it will take the exit at the
opening price. If the low of the bar is under the profit protection
point, it will exit at the profit protection point. |
|
|
$
Stop Loss: this works the same as the percentage stop loss, but
instead sets the stop at a fixed dollar loss. For example, with 100
shares purchased at $5 and a $75 stop loss, the position will be exited if
the price falls under $4.25. As with the % Stop Loss, the actual
position loss will be the specified $ Stop Loss plus slippage at the entry
and exit plus possible gap-down losses (if price opened under your stop
point.) |
|
|
$
Profit Protect: allows a fixed total dollar loss off the maximum
profitable point in the position before the position is closed. |
|
|
Time
Stop: Exits the position at the close after the specified number of
days. |
|
|
Volatility Stop:
Will use the settings you have defined in the Volatility Stop scan to exit positions. You can choose which
of the 3 stop levels to use for
the exit (1 = tightest, 3 = loosest) or you can check the 'Transition
Vol Stop' box to get the stop to start at the loosest level and then be
changed to the next tightest level after the number of days specified in
the 'Number Days' text box. For example, if you specify 5 for the
number of days, the stop will start at level 3, the loosest stop, and
then will change to level 2 after 5 days and then to level 1 after 10
days in the trade and will stay at that level until the trade is exited. |
|
|
Allow
Exit on First Day: This option allows you to specify whether a
position can be exited on the day it is taken (in other words the day
after the scan date.) TCScan+ tracks the high of the bar as the most
profitable point, and the low of the bar as the least profitable. It
is possible, therefore, that if an entry is taken at the open of a
large-range bar either the profit protection or stop loss point could be
hit on the same day (as it can be on any other day.) An example is
shown below. The position was entered at the open price of $3.59 and
the high and low were at $4.88 and $2.64 respectively. The low is
26% below the entry point, so if a 10% stop loss was held it would have
been triggered at $3.23. Likewise, if a 5% profit protection stop
was in place, it would have been triggered at $4.64. TCScan+ checks
the profit protection point before the stop loss, so would have recorded a
29% profit for this position, minus slippage. If you did not select the 'Allow
Exit on First Day' box, then the position would not have been closed on
this day. Instead, it would have been closed on the following day at
a lower profit, because that day opened below the profit protection point,
so would have been closed at the open price of $4.35 instead of the $4.64
profit protection point. |
|
|
Apply
stops at close only: When checked, TCScan+
will only consider the closing prices in deciding whether to exit a
position. In the above example, the stop loss would not have been
triggered because the close was not lower than $3.23. However, the
profit protection point would have been hit at the close of $4.07 because
it was below $4.64. |
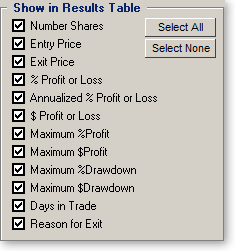
Check one or more of the trade statistics to display them in the results table.

The meaning of these items (along with their abbreviation shown in the results table) are as follows:
|
|
Number Shares (Shares): The number of shares of each items purchased. This number is either specified directly in the Position Size section or calculated from the dollar value of the position specified there. |
|
|
Entry Price (Entry$): The exact price at which the position was entered. |
|
|
Exit Price (Exit$): The exact price at which the position was exited. |
|
|
% Profit or Loss (%Profit): The percentage change between the exit and entry price for long trades (vice versa for short trades), adjusted for slippage. |
|
|
Annualized % Profit or Loss (%Annual): The same as above, but with the percentage adjusted for the number of days in trade to provide an annualized percentage change. This is useful for comparing different trades, each of which have a different duration. |
|
|
$ Profit or Loss ($Profit): The difference between the dollar value of the position at the entry and exit points, adjusted for slippage. |
|
|
Maximum %Profit/$Profit (Max%/Max$): Equivalent to the profit numbers above, but based on the highest high (long) or lowest low (short) over the trade period instead of the exit price. |
|
|
Maximum %Drawdown/$Drawdown (DrDown%/DrDown$): As above, but provides the maximum drawdown in the position. For a long position, this is the difference in position value between the entry and lowest low over the trade period. For a short position it is the difference between the entry and highest high. This statistic indicates how wide you would need to place your stops to not get stopped out of the position. |
|
|
Days in Trade (TrdDays): The number of days from the trade entry to its exit. |
|
|
Reason for Exit (Exit Reason):
An abbreviated reason
why the trade was exited will be shown in the results list. A summary of the abbreviations is provided
below and further details are available in the Exit Options section
above. |