Examples Parameter Description Typical Settings Results Table
Relative Strength Moving Averages (RSMA) are very useful in gauging how one item is performing relative to another item. They are calculated by dividing the price of the item by the price of the reference item, and then calculating a moving average of this ratio. They allow you to quickly separate items into ones performing better or worse than the reference item.
The Worden Brothers have discussed the use of RSMAs as a long-term profit protection method in their February 2000 Worden Notes, and we think they are very useful for this purpose. However, our preferred use of RSMAs is as a trading filter - we take long positions in an item when the short term RSMA is above the long-term RSMA and vice-versa. Click Here for some examples.
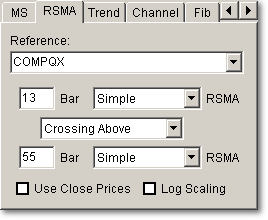
The RSMA
Tab allows you to set the parameters for your RSMA scan. You can select a
reference index from the drop-down box, or you can type in any item you wish
to be the reference. You can then set the period of the two moving
averages, their smoothing type, and their relative position. If you
selected the Use Close Prices box, then the RSMAs will be based on the
close price instead of the average price (of the open, high, low and
close.) You could
also select the Ignore Filter option,
which will disable the position drop-down box, to find the relative positions of
all the items in your lists. Checking the Log Scaling box will cause TCScan+ to use Logarithmic Scaling (instead
of the normal Arithmetic Scaling) for the charts. When using logarithmic scaling you will notice
that the price axis numbers on the chart do not increase linearly,
but rather proportionally. ![]()

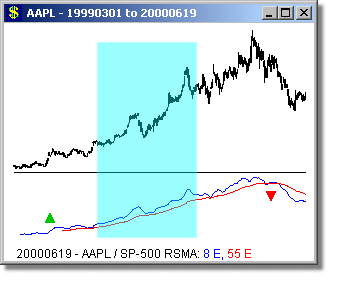
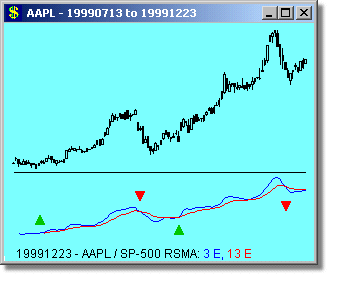
The Worden Brothers favor watching 10 and 40 day simple RSMAs, but we have found wider-spaced moving averages more effective - you should experiment and see what suits your trading style best. We like to use Fibonacci numbers as periods for our indicators, typically separating the one period from the other by two Fib numbers. So for example on a short-term basis we would watch a 3 day RSMA versus a 13 day RSMA, and for longer-term trading would watch a 13 day RSMA versus a 55 day RSMA. You could choose other combinations from the Fibonacci series: 1, 2, 3, 5, 8, 13, 21, 34, 55, 89, 144, etc. As an example, see the use of 8/55 RSMAs on the long-term chart of AAPL versus the use of 3/13 RSMAs during short-term moves.


We tend
to use exponential moving averages more often than simple moving averages, but
don't have a strong preference either way. Exponential averages are
typically more responsive, but less smooth than simple moving averages and
vice-versa. We prefer trading the Nasdaq, so use COMPQX as our reference,
but you could use the SP-500 as a more-general index for large caps, or the
RUT-X for small caps. ![]()
The
column headed 'Name' lists the names of the items that passed your filter
criteria. If you have selected the Crossing Above or Crossing
Below scan type then a column headed either '% Above' or '% Below' will list
the percentage that RSMA 1 is above or below RSMA 2. If you have selected
the Ignore Filter option, then a
column headed '% Diff' will list the percentage difference between RSMA 1 and
RSMA 2. Positive numbers in this column indicate that RSMA 1 is above RSMA
2, and negative numbers indicate that RSMA 1 is below RSMA 2. PTrnd and
VTrnd show the price and volume trend slopes respectively. ![]()