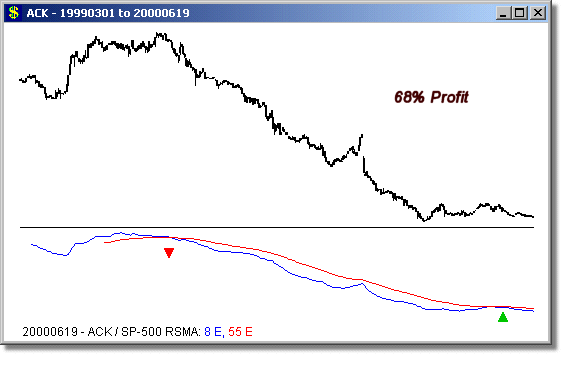
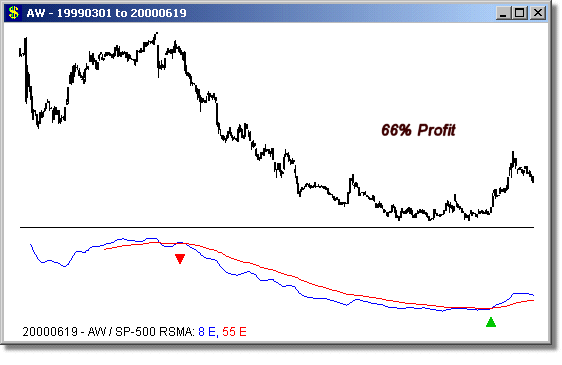
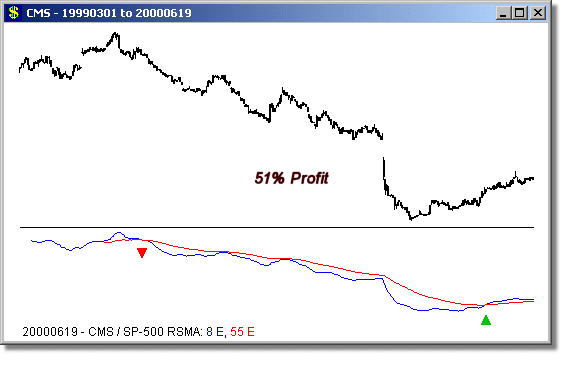
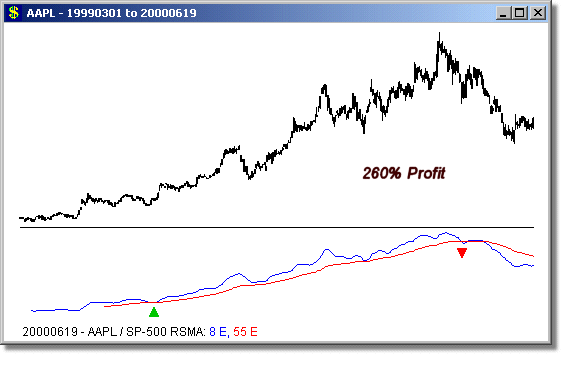
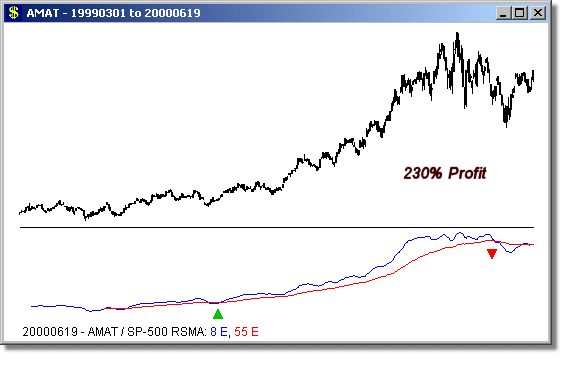
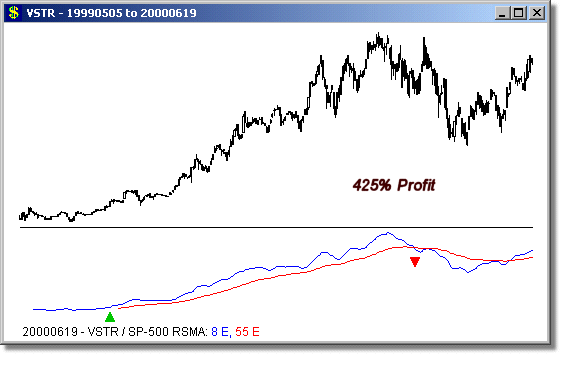
Following are some long and short examples using exponential RSMA crossovers. The charts show data from March 1, 1999 through June 19,2000, and illustrate how useful the RSMAs are as trading filters, and also as a long-term profit-protection method. The charts are based on crossovers of an 8 day exponential RSMA and a 55 day exponential RSMA, and are calculated relative to the SP-500.
Long Examples
Short Examples
