Pattern Index Bearish Patterns Bullish Patterns Examples Editing Patterns Formula Help
The Pattern Scan helps you identify traditional Japanese CandleStick patterns as well as a variety of other western patterns. Many patterns have been built into TCScan+ (see links above) and you can also define your own patterns using the same PCF language found in TeleChart.
Traditional Candlestick patterns were originally developed in Japan in the 18th and 19th centuries for rice futures trading. They have since become widespread throughout the world, in all forms of trading. They consist of groupings of bars in particular arrangements that have proven to be highly probable indicators of future movement. Many books are available to provide more details on Candlestick patterns. Our favorite is Candlestick Charting Explained by Gregory L. Morris. Another good one is Profitable CandleStick Trading by Stephen Bigalow.
Candlestick Bars
When you
understand their construction, candlestick bars are easier to read than the
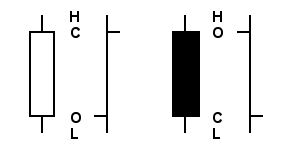
traditional western bars and convey more information. The open to close price range forms a body that
is colored white if it was an up day and black if it was a down day. Lines
are then drawn from the top of the body to the high, and from the bottom of the
body to the low. These lines are almost like the
wicks of a candle, with the body forming the candle itself and that is where
this bar type get its name. Shown below are pictures of white (up close)
and black (down close) candlesticks and their equivalent western versions. ![]()

Candlestick Patterns
Hundreds
of candlestick patterns are available, and trying to search and understand them
all can be quite confusing and unproductive. TCScan+ includes only the
more reliable ones, and provides the ability for you to add any other patterns
you choose. See:
Pattern Index
Bearish Patterns
Bullish Patterns ![]()
Pattern Tab
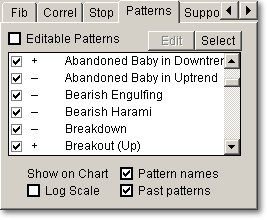
The Pattern Tab allows you to select which of the patterns to include in your scan. You can individually check or uncheck patterns in the list or press the 'Select' button to select or deselect groups of patterns at a time.

TCScan+ provides two different modes for pattern scanning. They use respectively:
Built-In Patterns that have been hard-coded into the TCScan+ program and can not be changed, deleted or added to, and
Editable Patterns that can be created and edited using the same language used in TeleChart to create PCF formulae. These Patterns can be edited, changed, deleted, and renamed. Furthermore, in this mode, you can add your own patterns as well.
The advantage of the Editable Patterns is that you can modify or add to them but their disadvantage is that the patterns have to be recompiled by TCScan+ each time they are run. As a result, scanning with these patterns is relatively slow, particularly when showing a chart with historical patterns shown on it. (When such a chart is shown, the program must check every day on the chart and run through all the patterns for that day to see if a pattern was in place.) The calculation speed is the reason why the Built-In Pattern option was included and set as the default. The Built-In patterns are written into the program itself, so calculations and chart display are much quicker. One option would be to use the Editable Patterns only for the patterns you add, while using the built-in patterns for the other scans. You can do this by using the checkboxes in the pattern selection list or clicking the Select button.
You can switch between the two modes by checking or unchecking the checkbox labeled Editable Patterns. When the Editable Patterns box is checked, you will see that the Edit button on the Pattern tab becomes enabled, allowing you to edit, rename, test and delete your patterns.
The checkboxes at the
bottom of the Pattern tab allow you to specify whether past patterns should be
highlighted on the chart, and whether pattern names should be displayed.
The Past Patterns setting is important to take note of if you are using the
Editable Pattern setting described above. In this case, TCScan will scan
all the data in your chart, displaying where past patterns appeared. If
you have a lot of data, the calculation can take a long time and slow display of
the chart.
![]()
Scanning for Patterns
The
procedure for finding patterns is very simple. All you need to
do is select the patterns you wish to find then press the 'Start Scan' button.
When running the Pattern Scan, you have the option of having symbols appear
on your charts to indicate where a pattern has been found. You also have the
option of displaying where patterns occurred in the past on your charts.
As explained previously, this option requires a lot of processing power,
particularly if you have a long lookback period, so can cause charts to appear
quite slowly. Your options to speed up the chart display are to select
fewer patterns to scan, switch from Editable Patterns to Built-In ones, and to
reduce your lookback period. See: Pattern
Scan examples. ![]()
The Editable Pattern definition files are stored individually in the Patterns folder of your TCScan+ directory (usually C:\Program Files\TCScan+\Patterns.) You can share any pattern files you create with other TCScan+ users by sending them the appropriate file and having them save it to their Patterns folder. When you delete any patterns (see below) TCScan+ will actually delete the corresponding file in this directory. Therefore be sure to make regular backups of your Patterns folder to prevent accidental loss.
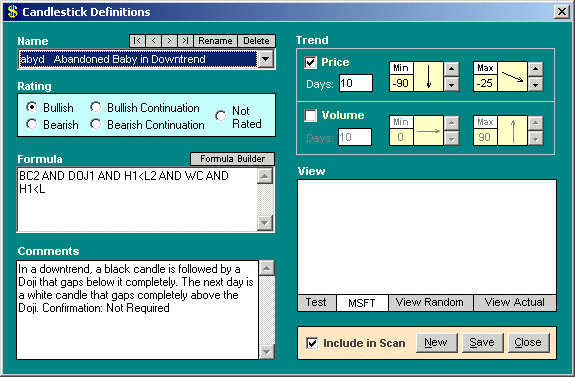
When the checkbox on the Pattern Scan Tab marked 'Editable Patterns' is checked, you change to Editable Pattern mode, and the 'Edit' button becomes enabled. Clicking on the 'Edit' button brings up the Pattern Editing Form.

This form allows you to:
|
|
Move between patterns - by selecting them from the drop-down list, or
using the navigation arrows just above the drop-down list.
|
|
|
Rename patterns or their abbreviation codes, by clicking on the 'Rename'
button just above the drop-down box. |
|
|
Delete patterns, by clicking the 'Delete' button just above the
drop-down box. |
|
|
Rate the patterns as Bullish, Bearish, Bullish Continuation, Bearish
Continuation, or Not Rated - by clicking the appropriate option button in
the Rating section. |
|
|
Edit the formula, by typing a formula into the Formula box.
The formulae are entered using the same language used in TeleChart to create
PCF formulae. All price-based variables available in TeleChart can be
entered here, as well as two extra variables: 'B' for the size of the body (Abs(O-C)),
and 'R' for the high to low range. It also provides codes to use for
candlestick building blocks, such as 'DOJ' for a Doji, 'BM' for a Black
Marubozu, 'LWC' for a long white candle, etc. You can click on the
button marked 'Formula Builder' just above the Formula box to get assistance
in creating the formulae. The Formula Builder form also allows you to
change the formulae for the candlestick building blocks.
|
|
|
|
|
|
Specify
the current trend in Price and Volume, by checking the Price Trend and/or
Volume Trend checkboxes then setting the number of bars over which to work out the trend.
The minimum and maximum trend angles can be specified by entering the values,
moving the arrows in the picture box, or clicking the up/down angles.
|
|
|
Test
the Patterns by entering a symbol to test and then pressing the 'Test'
button. The testing lookback period, shift and time frame will match that
used on the main TCScan+ form to help you debug/create patterns that you see
while doing other scans. |
|
|
View
the Patterns by pressing either the 'View Random' or 'View Actual' buttons.
The 'View Random' button causes TCScan+ to generate random price data that it
tests in the formula until it finds a match to the pattern you have entered.
Once found, the data is shown in the picture box above the button. The
'View Actual' button will load data from TeleChart for all the stocks over
approximately the last 100 days of trading. It will test every stock on
every day until it finds a match to the pattern, which it then displays on the
chart. The chart will also show the stock name and the date the pattern
was found. Both of these View methods can take a long time to show results
if you have a complicated or very restrictive pattern. We suggest starting
with the 'View Random' button and if nothing appears for a few minutes, then
trying the 'View Actual' button. Once clicked, you can click the button
again to stop the search. |
|
|
Include the Pattern in your scan by checking the box at the bottom of the
form. |
|
|
Create
New Patterns by pressing the 'NEW' button at the bottom of the form.
|
|
|
Save
your changes by pressing the 'SAVE' button at the bottom of the form.
|