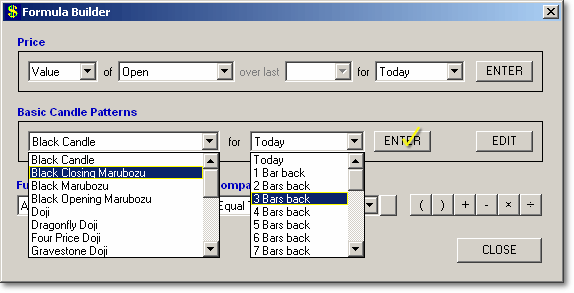
Pattern Formula Builder
The Formula Builder helps you to build your pattern formulae by selecting items from drop-down lists. The formulae can consist of price data (e.g. O,H,L,C,V), mathematical functions (e.g. ABS, AND, OR) and also primal or basic candle patterns. For example, if you select 'Black Opening Marubozu' in the drop-down list in the middle-left of the form then select '3 Bars back' from the drop-down list next to it and then press the ENTER button, the pattern abbreviation 'BOM3' will be added to the formula box on the Pattern Edit form. (See the picture below.)

You can also select functions such as Absolute Value from the functions drop-down list at the bottom of the form then press the button just to the right of the drop-down list to have the formula for the function entered.
Likewise, you can enter price patterns from the 'Price' section at the top of the form. For example, if you wanted to know the formula for the largest body size for the 5 bars up to yesterday, then you would select the following in the 'Price' section followed by clicking the ENTER button.

A summary of the basic candle patterns included in TCScan+ is listed below. You can edit/view these basic patterns formulae by clicking the EDIT button in the middle-right of the Formula Builder form.
|
Name |
Code |
Picture |
Description |
Black Candle |
BC |
|
A down-close bar, i.e., any bar that closes lower than it opens. |
Black Closing Marubozu |
BCM |
|
A down-close bar where the close is at the low, i.e., there is no wick on the bottom. This is a strong indication of continued bearishness in a downtrend. |
Black Marubozu |
BM |
|
A down-close bar where the open is at the high and the close is at the low, i.e., there are no wicks on the candle. This is generally an indication of bearish continuation. |
Black Opening Marubozu |
BOM |
|
A down-close bar where the open is at the high, i.e., there is no wick at the top. This is an indication of continued bearishness in a downtrend, but is not as strong a signal as a closing marubozu. |
Doji |
DOJ |
|
A bar where the open and the close are equal. Dojis are a stronger form of the spinning top, indicating a strong contest between bulls and bears. They should be watched as a sign of reversal during a trend, especially in an uptrend. |
| Dragonfly Doji | DDOJ |
|
A Doji where the open and close are at the high of the bar. |
| Four Price Doji | FDOJ |
|
A flat bar, i.e., the open, high, low and close are equal or very close to each other. |
| Gravestone Doji | GDOJ |
|
A Doji where the open and close are at the bottom of the bar (inverse of the Dragonfly Doji.) |
| Long Black Candle | LBC |
|
A down-close bar whose body is significantly larger than average. |
| Long White Candle | LWC |
|
An up-close bar whose body is significantly larger than average. |
| Long-Legged Doji | LLD |
|
A Doji that has longer than average upper and lower wicks. |
| Short Black Candle | SBC |
|
A down-close bar that has a shorter body than average. |
| Short White Candle | SWC |
|
An up-close bar that has a shorter body than average. |
| Spinning Top | ST |
|
A bar that has a much shorter body than the range. This is an indication of indecision in the market and is considered neutral in a sideways market. In a trending market, however, the next day should be watched as an indication of the future trend. |
| White Candle | WC |
|
A bar where the close is higher than the open. |
| White Closing Marubozu | WCM |
|
An up-close bar where the close is at the high. This is a strong indication of continued bullishness in and uptrend. |
| White Marubozu | WM |
|
An up-close bar where the open is at the low and the close is at the high. This is generally an indication of bullish continuation. |
| White Opening Marubozu | WOM |
|
An up-close bar where the open is at the low. This is an indication of continued bullishness in an uptrend, but is not as string a signal as a closing marubozu. |