Support and Resistance Level Scan
Parameter Description Typical Settings Results Table
The Support and Resistance Level scan allows you to find horizontal support and resistance levels, where upward price movement is hindered (resistance) or downward price movement is prevented (support.) In addition to the well-known price-based support and resistance levels, TCScan+ also allows you to find volume-based levels.
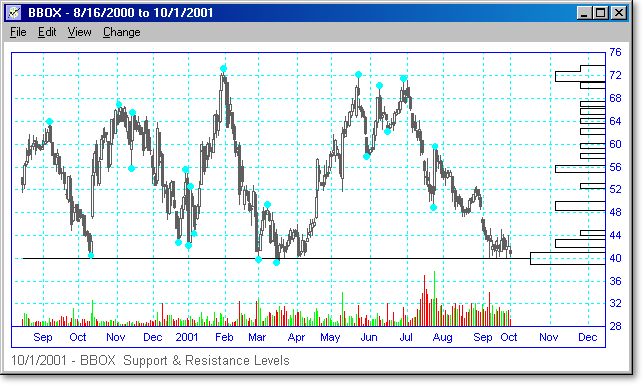
Price-based support and resistance levels are found by searching through the stock data and locating all the points where price has changed trend previously. These pivot points become high-probability locations where price will turn again. TCScan+ sums the number of past pivot points and displays the count at each price level in the form of horizontal bars on the right of the chart - an example is shown below. The wider (left-right) the bar, the more past turning points there have been within the range of that bar. Generally the more turning points at a certain location, the more likely the chance that price will turn there again. However, there is an opposing principal that the more a level is "tested" the weaker it gets - therefore it is prudent to have well-placed stops no matter how sure you are of a level. We have also seen time and again where only one previous turning point has meant enough to cause price to turn there again.
In the chart for BBOX below, you can clearly see the strong support around 40 for this stock, along with less-significant levels. In the two months following this scan date, the stock climbed up to around 57 again.

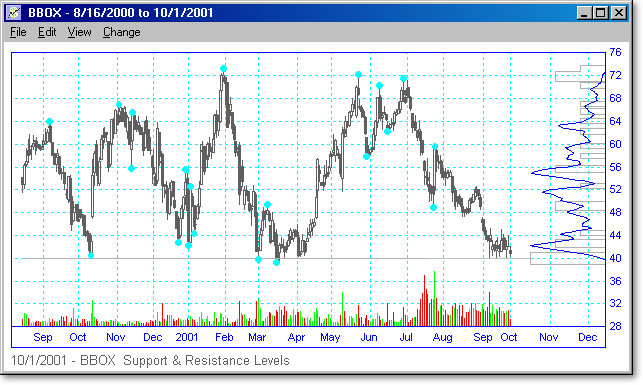
Volume-based support and resistance levels are found by summing the daily volume at each price level to create a cumulative curve of past volume activity at each price. You can therefore see at what price levels there has been a lot of trading activity. As with the price level boxes, this curve is plotted on the right of the chart in TCScan+. The chart below is the same as the one above, but now includes the cumulative volume curve. (The price boxes have been colored lighter to make the volume curve easier to see.) The peaks on the curve show where there has been a lot of past volume activity at that price level. For example on the chart below, you can see a lot of volume activity occurred at prices around 42, 52 and 55.

Unlike
price-based pivot points, volume activity occurs at virtually every price level,
so you do not get the nice square support boxes that you get with the price
levels. Therefore, to help differentiate the peaks from other activity,
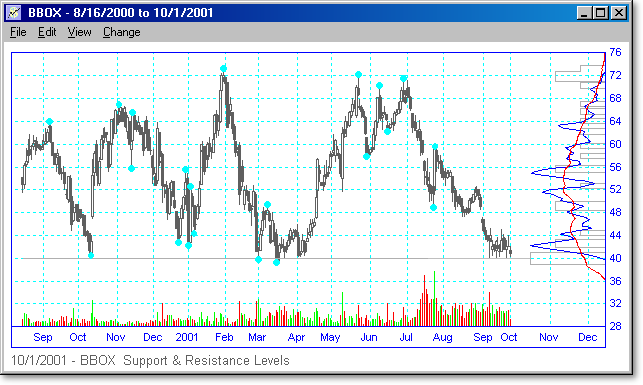
TCScan+ also works out a moving average of the volume curve. Wherever the
peak extends to the left of the moving average, volume activity has been above
average. The chart below shows the moving average in red plotted in
addition to the volume curve in blue. You can get TCScan+ to alert you
whenever price is close to one of these above average peaks. Our studies
have shown that volume peaks are good anticipators of price turning points.
The most likely explanation is that the bulls and bears fight it out at certain
points (high volume), then one group wins and you get a push in one or the other
direction. At this point, price is overextended and you get a turning
point. ![]()

The
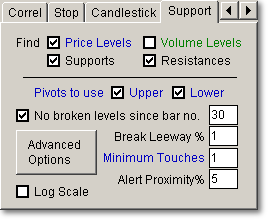
picture below shows the Support and Resistance Scan tab, with default settings.
Settings that specifically apply to the Price-based levels are shown in blue,
and those for volume-based levels are shown in green. There are no
specific Volume-based settings on the main tab, but there are some options on
the advanced options page (described below.) Settings that apply to both price and
volume-based levels are shown in black. ![]()

|
|
Price Levels / Volume Levels checking these boxes will search for proximity near price-based or volume-based levels respectively. Levels will still be generated for both level types, even if one type is unchecked. |
|
|
Supports / Resistances these boxes are used to specify whether to find supports or resistances. Since a support can become a resistance and vice-versa depending on price position, this setting decides whether a level is a support or resistance by looking at the current price trend. If price is going up since the last pivot point then the level is classed as a resistance, and if it is going down it is classed as a support. |
|
|
Pivots to use: Upper / Lower are used to tell TCScan+ whether to use either the upper or lower pivot points (or both) in looking for the price-based levels. |
|
|
No broken levels since day no. can be checked so that you will not be alerted to levels that have been broken over the past period you specify. |
|
|
Break Leeway is the percentage leeway (tolerance) in determining if the level has been broken. This is useful, because levels are sometimes broken slightly, but still hold. |
|
|
Minimum Touches is the minimum number of previous touches to a price level for you to be alerted to proximity near it. |
|
|
Alert Proximity% specifies how close the current price must come to the level, in percent, for you to be alerted of that fact. If you want to ignore this setting then leave the box empty. |
|
|
Advanced Options Clicking this button will open the Advanced Options
form, as shown below. Most of the settings should be clear from the
description, but you can click on the picture below to get further information.
|
The
settings shown on the tab the first time you use it are a good start to using
this scan type. For the price level scan, you can also try adjusting the
minimum number of touches and the retracement% (on the advanced tab). The
minimum touches setting will help you find more stable support/resistance
levels, and the retracement% will help you adjust the sensitivity to turning
points. A lower retracement% will cause shorter-term turning points to be
considered, whereas a higher number will get only longer-term pivots considered.
Sample settings are included in the TCScan+ directory - you can access them
using the File > Load Scan Settings command, or pressing the F11 key.
![]()
The
column labeled 'type' will list a 'P' and/or 'V' depending on whether a price or
volume-based level had been hit. The 'P Value' and 'V Value' columns will
then show the values of the levels that have been hit. As with the other
scans, 'PTrnd' and 'VTrnd' show the price and
volume trend slopes respectively. ![]()