Correlation Scan Examples
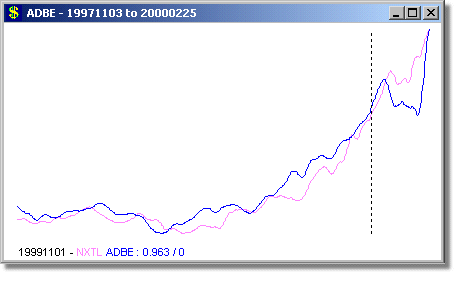
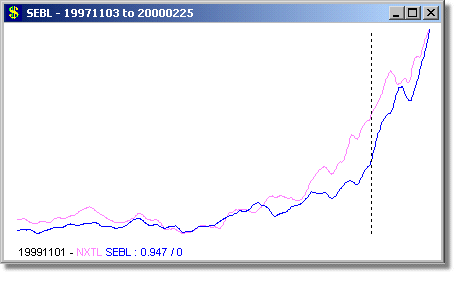
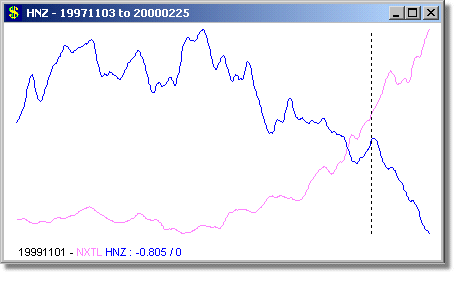
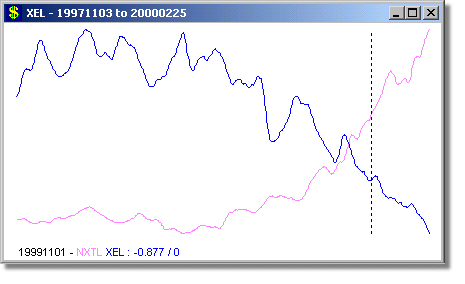
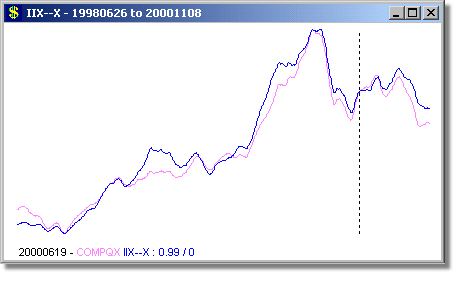
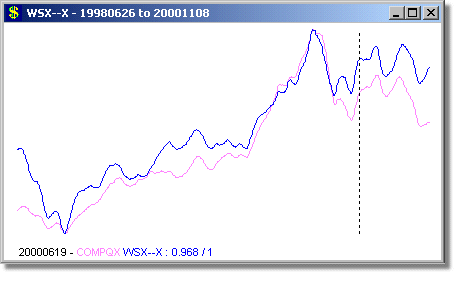
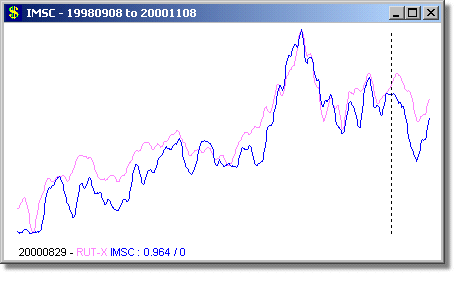
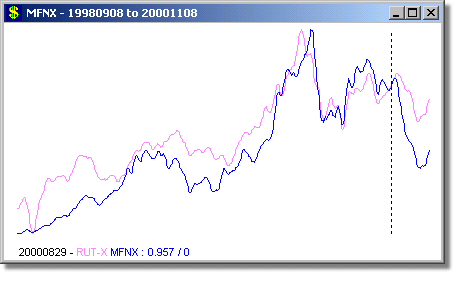
Following are some examples of Correlation scans with different time periods. The vertical dotted line shows the day of the scan, the data following it shows how the linkage continued after the scan date. Note the correlation coefficient values printed at the bottom of the charts, followed by the offset.
The first two charts show two stocks highly-correlated with NXTL - note how their behavior is similar after the scan date.
The next two charts show stocks that are anti-correlated with NXTL - note how they keep moving in opposite direction to NXTL after the scan date.
The next two charts show Indices highly correlated with the Nasdaq Composite, COMPQX. You can run the same scan with stocks.
|
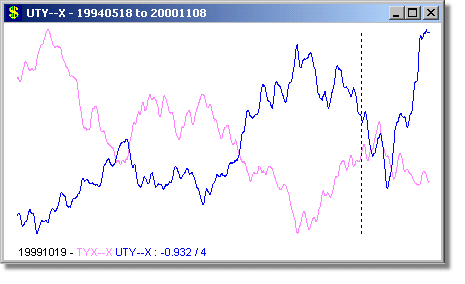
Here is a good example of long-term anti-correlation in indices: The 30-Year Bond index (TYX--X) versus the Utility Index (UTY--X) over a period of almost six years. Note the offset by four days, but over a long period such as this we would not consider this amount of offset to be significant. |
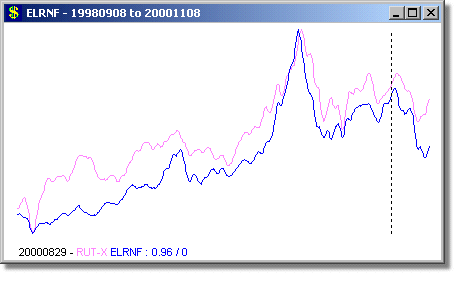
The last three charts show stocks highly correlated with the Small Cap Russell 2000 Index (RUT-X).
Home Video Download Purchase Help
© 2012 Rijker LLC